As
an extraordinary year draws to a close, all that is
clear for the future is that very little is clear.
In the global economy, many processes that were unleashed
during this period are yet to unfold fully, and their
future direction is dependent upon several imponderables,
not least of which is the strength of the policy response
to the ongoing financial crisis and economic recession.
As this response by governments across the world is
still not co-ordinated, not even between the major
players of the capitalist system such as the US, the
European Union (particularly Germany) and Japan and
China, the immediate future remains bleak, since it
means that the market-driven forces of downswing are
likely to rule for some more time.
One feature of the recent past has been the extreme
volatility of global commodity markets, which have
experienced unprecedented price swings in the course
of the past year. Because economic analysts have become
more and more short-term and short-sighted in their
outlook, each of these rapid movements has been over-interpreted
as reflecting structural changes in global demand
and supply rather than conjunctural forces that are
themselves liable to change.
For example, when global prices in oil and other commodity
markets zoomed to stratospheric levels by the middle
of 2008, we were told that it had nothing to do with
speculation. Eminent economists joined bankers, financial
market consultants and even policy makers, in emphasising
that these price rises were all about “fundamentals”
that reflected real changes in demand and supply,
rather than the market-influencing actions of a bunch
of large players with enough financial clout and a
desire to profit from changing prices.
In oil markets, we were warned that the dire predictions
of the “peak oil” doomsayers were finally coming to
pass. In global food markets the rise in prices of
staples was correctly identified to be at least partly
related to the medium term policy neglect of agriculture
by governments especially in the developing world,
but the role of speculation in commodity futures,
enabled by financial deregulation, was denied.
Further, it was also argued that the real gainers
of this process were the direct producers: not only
oil exporting countries but small farmers producing
food grains that were becoming highly valued internationally.
The commodity price boom was supposed to translate
directly to income gains for such producers, to the
point where some governments even argued that there
was no need to provide any protection to agriculture
since cultivators were already gaining from the high
crop prices.
But the subsequent collapse of commodity prices -
both oil and non-oil - has shown how wrong the earlier
explanations were, and how little primary commodity
producers are likely to have gained, especially small
producers in the developing world. Chart 1 tracks
the behaviour of the aggregate indices of primary
commodity prices in world trade over the past two
years.
It is evident that all the price gains of the period
January2007 to mid-2008 have been wiped out by the
later fall in prices. Oil prices in November 2008
were back to the nominal level of January 2007, which
implies a decline in real terms. And non-oil commodities,
specifically agricultural raw materials and metals
were actually lower even in nominal terms. It is worth
noting that the latter group did not experience much
of a price rise even when the commodity price boom
of 2007-08 was supposedly operating in full force.

Chart
1 >> Click
to Enlarge
The likelihood of agriculturalists benefitng from
such a short-lived price boom is therefore unlikely,
especially given the lags of supply response. Indeed,
it is even likely that they could face opposite effect:
farmers shifting acreage in response to price increases
could find that prices have crashed by the end of
the growing season.
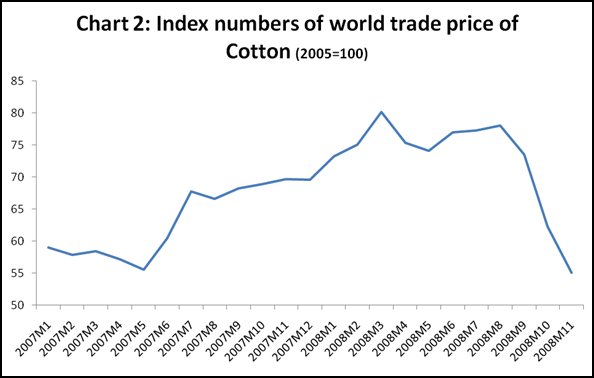
Consider, for example, the case of cotton, the most
widely planted non-food cash crop that directly affects
the livelihood of millions of farmers. Chart 2 shows
the behaviour of cotton prices, providing an index
of the Liverpool c.i.f price of middling staple cotton.
This price had fallen significantly in the past few
years, so that in January 2007 it was less than 60
per cent of the level reached in 2005. The price started
to increase around the middle of 2007, and by March
2008 had increased by 44 per cent compared to May
2007. But after that peak there has been quite a sharp
crash in prices in just a few months, such that in
November 2008 the price was actually lower than it
had been in January 2007!
Such volatility can be only very partially expalined
by real changes in demand and supply, It is true that
there was an increase in demand from China, the world's
foremost garment exporter, around the middle of 2007.
But the rapid price thereafter was beacuase speculators
took over. Similarly, while the ongoing global recession
has affected demand for clothing and therefore for
cotton, the collapse in prices cannot be explained
only by this decline, but is also the result of speculators
offloading their stocks.
The point is that cultivators who had responded to
the price signals of the short-lived boom to sow more
cotton will now find themselves stuck with a crop
whose price has nearly halved in just eight months.
Chart
2 >> Click
to Enlarge
The other major cash crops that dominate cutlivation
are all oilseeds, and here too, very volatile and
sharp swings in prices are evident over the recent
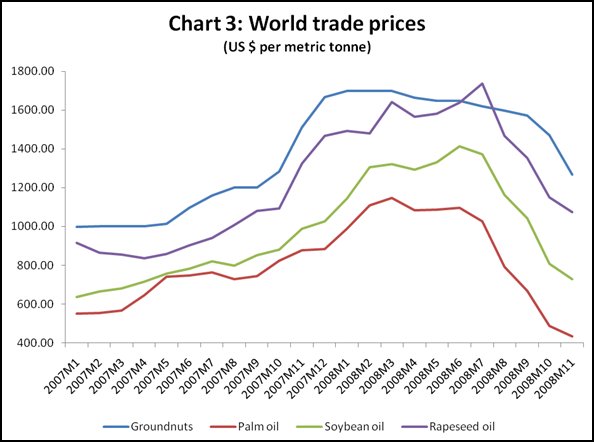
period. Chart 3 describes the behaviour of world trade
prices of groundnuts which are used to make peanut
oil, as well as the other major cooking oils: palm
oil, soybean oil and rapeseed oil. All of them show
similar trends in prices, with continuous and substantial
increases from January 2007 onwards, followed by sharp
declines int he second half of the current year.
Only groundnuts prices are still significantly higher
than they were at the start of the period, having
increased by 70 per cent over 2007 and then fallen
by 34 per cent in the current year. Soybean oil prices
more than doubled between January 2007 and March 2008,
and then fell by 45 per cent, so that in Novemeber
2008 the price was only 15 per cent higher than it
was at the start of the period. A similar tendency
was apparent for rapseed oil. The sharpest rise and
fall occurred in the palm oil price – increasing by
208 per cent to March 2008 and then declining by 62
per cent, such that the price in November 2008 was
more than 20 per cent lower than it had been in January
2007.
Once again, cultivators who opted to sow these crops
when their prices were at their peak would now have
to face a completely different environment with very
different configurations of costs and prices that
coudl easily make the cultivation process completely
unviable financially.
Chart
3 >> Click
to Enlarge
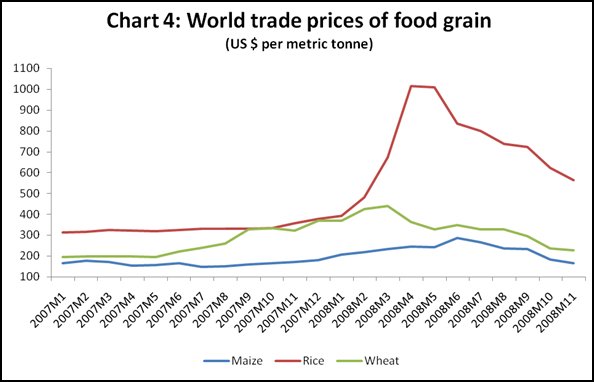
Among the agricultural prices
that matter the most, of course, are food grain prices.
The world food crisis that briefly grabbed international
headlines in the middle of the year was essentially
reflected in very darmatic increases in prices of
the most important food grains. As Chart 4 shows,
these too have been subject to significant volatility,
especially in the current year.
Chart
4 >> Click
to Enlarge
The most extreme trends have been evident in rice
prices, which were broadly stable, increasing only
gradually though most of 2007, but then exploded to
increase by more than two and a half times between
January and May 2008. Rice prices have fallen thereafter
but are still 80 per cent higher than they were at
the start of the period.
Some of this is atributable to the fact that the world
trade market for rice is relatively thin compared
to total production, as most rice producing countries
are also major consumers of their own output. The
sharp rise in prices in early 2008 can be partly attributed
to the export bans imposed by two major exporters:
India, which the previous year exported around 5 million
tonnes and Egypt which exported around 2 million tonees
out of total world exports of around 18 million tonnes.
Once again, however, speculative pressures are likely
to have pushed up trade prices well beyond anything
that could be explained by demand-supply imbalances.
Wheat prices also more than doubled between January
2007 and March 2008, and declined subsequently although
they are still 16 per cent higher than they were at
the start of the period. Maize prices went up less
sharply but continued to increase until June this
year, but thereafter fell so sharply that the maize
price is now below what it was in January 2007.
While world trade prices of these food grains did
fluctuate dramatically, and have now fallen in ways
that will adversely affect exporters of these crops,
retail prices of these grains have not come down in
most developing country markets. Therefore we have
a strange situation in which both the direct producers
and the final consumers appear to be worse off because
of the volatility.
In another context it could be concluded that speculators
have gained from this boom-and-bust price cycle, but
given the chaos in global financial markets even such
a conclusion may not be warranted. A weird example,
then, of a negative sum game in global capitalism.
