It
has been some time now since the government has stopped
bothering too much about the balance of payments.
Indeed, the continuous and even excessive build-up
of foreign exchange reserves (which now stand at more
than $310 billion, making India’s holding the fourth
largest in the world) suggests that the problem may
be one of plenty rather than scarcity, far removed
from the days when the foreign exchange constraint
was seen as binding upon domestic economic growth.
This has led to an attitude of complacency, not only
among policy makers but even among the wider public,
whereby balance of payments issues are rarely taken
as potential problems. It is even common to hear the
argument that the best way to manage the current inflation
within the country is simply to liberalise imports
further, on the assumption that our foreign exchange
situation is presently quite comfortable. Yet this
argument is flawed not only because it ignores the
potential damage to domestic activity and employment
from more imports, but because it underestimates the
fragility of recent tendencies in the balance of payments.
In fact, there are several sources of concern in the
recent pattern of external payments. The build-up
of reserves has been led by substantial inflows in
the capital account, which are either debt-creating
or inherently short-term and speculative in nature.
And this has been accompanied by the emergence and
increase in current account deficits, which make India’s
foreign reserve accretion fundamentally different
from and more problematic than it is in other countries
with large reserves, such as Japan and China.
For much of the past decade, India’s current account
was in surplus, because the trade deficits were more
than compensated by substantial increases in remittances
from workers abroad and software exports. However,
in recent years deficits have emerged, largely because
of the significant growth in trade imbalance. In the
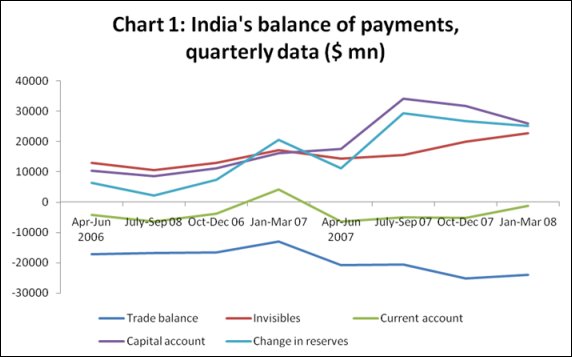
past two years, as Chart 1 shows, the current account
has been in deficit in almost every quarter, and the
imbalance has widened sharply in 2007-08.
Chart
1 >> Click
to Enlarge
Chart 1 also shows the very significant role played
by net invisibles, which have been growing continuously
in almost every quarter. The trade balance, by contrast,
has been deterioriating, and quite sharply after April
2007. This has led to a trade deficit for the entire
financial year 2007-08 of more than $90 billion. The
increase in net invisibles has not been enought to
counteract this, so that the total current account
deficit for the year was $17.4 billion. By the last
quarter of 2007-08, this meant that the current account
deficit amounted to 1.6 per cent of GDP, and the trade
deficit alone amounted to 8.4 per cent of GDP!
This is the trade deficit based on the RBI’s figures,
which are quite different from the commercial data
released by the DGCI&S. Indeed, the difference
between the import data from the two sources has grown
from $5.5 bn in 2006-07 to $12.8 bn in 2007-08. This
is largely because the RBI data include some imports
made by government (including of defence equipment
and the like) that do not go through the customs process
and are therefore not recorded by the DGCI&S.
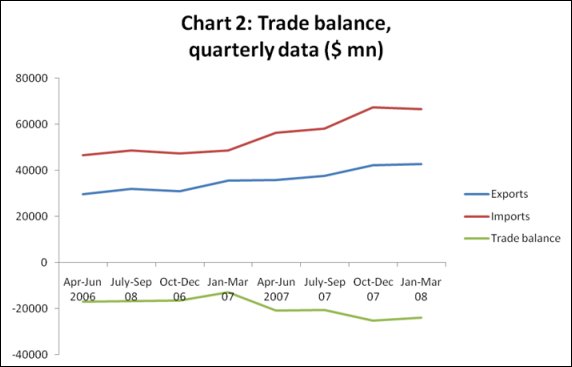
The worsening of the trade balance has been rapid
after March 2007, as indicated in Chart 2. This is
essentially because of a sharp acceleration in imports,
since exports continued to grow at more or less the
same rate as before. Over the year, exports increased
(in dollar terms) by 24 per cent but imports increased
by 30 per cent.
Chart
2 >> Click
to Enlarge
It is often believed that the rapid growth of imports
in 2007-08 was essentially because of the dramatic
increase in oil prices, which naturally affected the
aggregate import bill. Certainly this played a role,
but some non-oil imports also increased rapidly. Therefore,
while oil imports in the last quarter of 2007-08 were
89 per cent higher (in US dollar terms) than in the
same quarter of the previous year, non-oil imports
were also higher by 31 per cent.
Table 1 provides an idea of the commodity categories
that were the main drivers of export and import growth
over the past year. The most rapid growth of exports
was for agricultural commodities, which is a circumstance
with both positive and negative features. The export
of engineering goods was also quite rapid, as were
exports of gems and jewellery and chemicals. Agricultural
goods were dominantly exported to West Asia, whereas
engineering goods and ores and minerals were increasingly
exported by India to China.
Table
1:
Important Trade
Items in 2007-08 |
|
Share %
|
Growth %
|
|
Exports |
|
Engineering goods |
20.91 |
11.65 |
|
Petroleum products |
15.64 |
18.46 |
|
Gems &
Jewellery |
12.36 |
9.47 |
|
Chemicals & related
products |
13.63 |
4.71 |
|
Textiles |
11.38 |
-2.08 |
|
Agriculture & allied
products |
8.43 |
37.16 |
|
Ores & minerals |
5.66 |
14.42 |
|
Leather & leather
goods |
2.16 |
1.21 |
|
Electronic goods |
2.11 |
1.48 |
|
Imports |
|
Petroleum products |
32.75 |
34.97 |
|
Machinery |
13.81 |
23.94 |
|
Electronic goods |
8.55 |
27.77 |
|
Gold |
7.08 |
17.5 |
|
Iron & steel |
3.53 |
41.12 |
|
Pearls, precious &
semi-precious stones |
3.33 |
6.59 |
|
Transport equipment |
3.07 |
65.31 |
| Organic
chemicals |
3.05 |
32.83 |
|
Source:
DGCI&S |
Table
1 >> Click
to Enlarge
Two items of exports deserve special mention. First,
the export of petroleum products has increased rapidly
from 2005 when domestic private refining companies
were first allowed to export, and last year amounted
to more than 15 per cent of the total value of exports.
Such exports (mainly of high-speed diesel, motor spirit
and other light oils and preparations) are dominated
by one private refiner, and interestingly the UAE
and Singapore have emerged as the major markets for
this. Second, textiles and textile products, which
were earlier among the more dynamic exports, actually
declined in value over the past year, reflecting the
increased competitive pressure from other developing
countries, especially China, in the phase after the
removal of the Multi-Fibre Arrangement.
Table 1 makes it clear that petroleum products were
not the only rapidly increasing imports. While aggregate
imports grew in value by 30 per cent over the year,
oil imports increased by 35 per cent. But the import
of transport equipment (including motor vehicles)
increased by 65 per cent, of iron and steel by 41
per cent and of organic chemicals by 33 per cent.
Even machinery and electronic goods imports increased
rapidly, reflecting the domestic investment and middle
class consumption booms.
Table
2: Major Trading
Partners
in 2007-08 |
|
Share %
|
Growth %
|
|
Exports |
|
USA |
13.02 |
-2.37 |
|
UAE |
9.66 |
13.62 |
|
China |
6.78 |
15.66 |
|
Singapore |
4.31 |
0.46 |
|
UK |
4.14 |
4.21 |
|
Imports |
|
USA |
11.3 |
37.99 |
|
UAE |
8.1 |
28.98 |
|
China |
5.62 |
38.44 |
|
Singapore |
5.51 |
0.08 |
|
UK |
4.58 |
28.15 |
|
Source:
DGCI&S |
Table
2 >> Click
to Enlarge
These commodity-wise trends were mirrored in the direction
of trade. The most significant tendency was the continuing
decline in the importance of the USA in India’s merchandise
trade. Exports to the US actually declined US dollar
terms, and imports from the US barely increased. As
a result, by the last quarter of 2007-08, China had
emerged as the largest trading partner for India,
with imports from that country significantly outpacing
exports to it. As is evident from the import data,
the increase in non-oil imports by India was dominated
by China. The UAE and Saudi Arabia have become important
in intra-industry trade in petroleum products, as
noted above.
While merchandise trade may show a large imbalance,
in the past the surplus on invisibles has generally
been large enough to make the current account positive
or in very small deficit. This was generally because
of two important inflows: the receipts from exports
of software services, which include many IT-enabled
services such as Business Process Outsourcing, and
remittances from Indian workers abroad which come
in as private transfers.
Table
3:
Invisible Payments
in 2007-08, $ mn |
|
Credit |
Debit
|
Net |
|
Total Services |
87,687 |
50,137 |
37,550 |
|
Software
Services |
40,300 |
3,249 |
37,051 |
|
Business
Services |
16,624 |
16,668 |
-44 |
|
Other
Services |
30,763 |
30,220 |
543 |
|
Private
Transfers |
42,589 |
1811 |
40,778 |
|
Investment
Income |
13,799 |
19,038 |
-5,239 |
|
Travel |
11,349 |
9,231 |
2,118 |
|
Source:
RBI |
Table
3 >> Click
to Enlarge
However, in 2007-08, while these inflows remained
large, there are other indications that invisible
payments cannot be counted upon to finance the trade
deficit to the same extent in future. Thus, while
software exports remained buoyant, they are unlikely
to remain unaffected by the slowdown in the major
market, the US, in the current year.
However, private transfers are more complex. That
part of remittances which is from the US may be adversely
affected, but the rise in oil prices in imparting
new dynamism to oil-exporting West Asian countries
where most Indian workers abroad currently reside.
Inward remittances amounted to nearly $43 bn in 2007-08,
increasing by 47 per cent over the previous year.
They were almost equally divided between inward remittances
for family maintenance, and local withdrawals or redemptions
from NRI deposits. In 2007-08, the inflows and outflows
under NRI deposits were almost the same. But a growing
proportion of withdrawals from NRI deposits are repatriated,
rather than used within the country. This ratio increased
from 15 per cent of total withdrawals in 2006-07 to
35 per cent in 2007-08.
Two negative elements of the invisibles balance deserve
more analysis. Investment income predictably exhibits
a deficit. Both inflows and outflows of investment
income have increased sharply in 2007-08. However,
the rise in inflows should not suggest that the much-vaunted
new international clout of Indian corporates is finding
expression in the balance of payments as well, as
reinvested earnings of Indian investment abroad accounted
for only a small part of the inflows. Instead, these
inflows were dominated by the interest earnings on
foreign exchange reserves held abroad, which amounted
to more than $10 bn, or 73 per cent of the total inflows
on this account.
Meanwhile, interest payments on external commercial
borrowing (ECB) emerged as one of the largest outflows
of investment income in 2007-08, amounting to $4.2
bn – an increase of 250 per cent over the previous
year! The relaxation of rules for ECBs has clearly
led to a significant expansion of such borrowing by
Indian companies, and some of this may become more
problematic as higher global interest rates and deceleration
of growth affect the ability to repay. Repatriation
of dividends and profits by multinational firms operating
in India remained high at $3.3 bn.
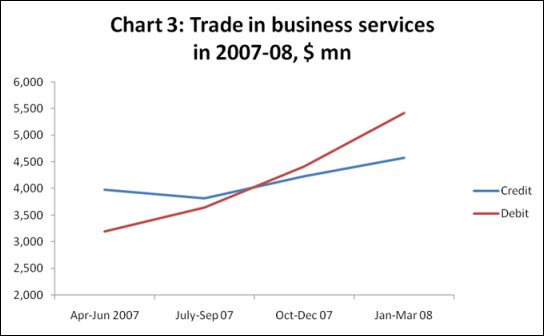
The other significant negative item is that of business
services. While the deficit on this account was small,
it is still significant because this was a positive
item until very recently. In fact, this account turned
negative only in the middle of last year, as Chart
3 shows. Within business services, over the entire
year, the categories of business and management consultancy
and architectural, engineering and other technical
services showed substantial deficits.
Chart
3 >> Click
to Enlarge
The travel account of invisibles is still in surplus,
but that surplus has been declining in recent years
as economic liberalisation has increased both the
volume and value of outbound tourist and business
traffic by Indian residents. Travel payments (outflows)
increased sharply by 38 per cent in 2007-08.
Clearly, therefore, there are some areas of concern
in recent trends in the current account. When these
are combined with the clear signs of fragility in
the captial acount, including the heavy dependence
upon short-term flows, we cannot continue to treat
the accretion to the country’s foreign exchange reserves
as a sign of strength.
