The Calorie Consumption Puzzle
One
of the more startling, but less discussed, features of Indian
development over the past several decades, is the decline in per capita
calories consumption which is revealed by the official National Sample
Surveys. Average calorie consumption in India was already low by
international standards, and that it has actually declined despite
apparently high aggregate economic growth rates is clearly something
that merits much more attention.
Of course, the most recent data that we have on calories consumption,
from the 55th Round of the NSS, is unfortunately not
comparable with data emanating from the earlier rounds. This has been
discussed at length in this column as well as by Abhijit Sen (2001,
2002) so we will not dwell on it further here. However, it does mean
that, along with estimates of consumption expenditure, estimates of food
consumption are likely to be overestimates when compared to the earlier
rounds.
Nevertheless, even these (relatively) inflated data indicates a decline
in per capita calorie consumption for rural India in 1999-2000, as shown
in Chart 1. The more significant trend, of course, is the long-term
decline since the early 1970s. In addition, there is what appears to be
a convergence between rural and urban patterns of calorie consumption by
the most recent period.
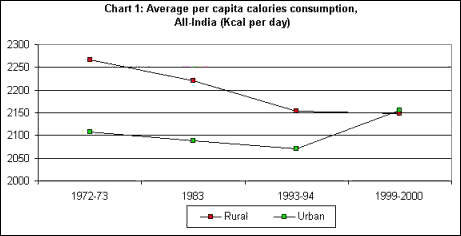
Indeed, in 1999-2000, the estimates of per capita calorie consumption in
urban India were higher than for rural India, at 2156 Kcalories per day
compared to 2149. This is surprising given the perception that the rural
population tends to consume more calories because of the greater
intensity of work in rural areas.
The pattern in overall calories consumption is mirrored in per capita
protein consumption, which is shown in Chart 2. Here also, rural areas
have experienced a substantial decline from the early 1980s in
particular. This decline has extended up to 1999-2000 even though the
estimate for that period may be higher relative to the earlier rounds
because of the change in pattern of questioning. Meanwhile, urban
protein consumption appears to have increased, to the point of
convergence.
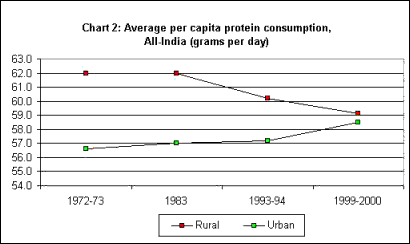
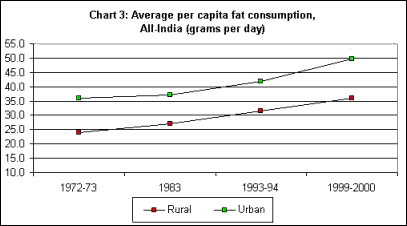
Chart 3, which describes trends in per capita fat consumption, actually
indicate an increase over time for both rural and urban areas. This is
part of a diversification in food consumption that does certainly appear
to have occurred on average over the past decades. Overall, while cereal
consumption seems to have fallen as a share of total calories, within
the category there has been a shift from the so-called "inferior grains"
to rice and wheat, especially among the poorer categories.
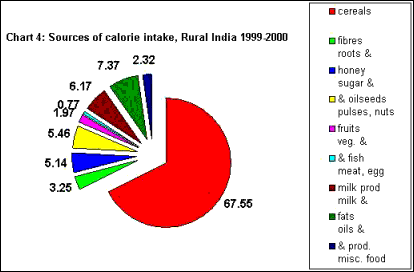
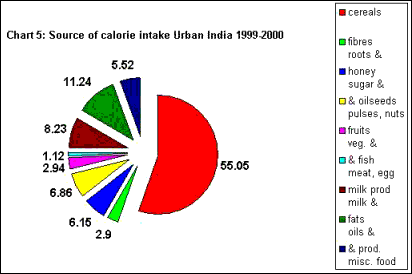
The range of non-cereal foods has diversified, with the greater
significance of milk products (which would contain more fat) as well as
edible oils, along with fruits and vegetables. The current patterns of
food consumption for rural and urban India are indicated in Charts 4 and
5. It should be remembered that these are the aggregate tendencies and
that there are significant variations across expenditure classes.
There has been some discussion on how to interpret the long-term
tendency towards declining per capita calorie consumption, especially in
rural India. One argument that is frequently made is that the early NSS
Rounds, including those of the 1970s and early 1980s, tended to
overestimate calories (and especially food grain) consumption. This is
then extended to argue that the subsequent estimates are mere
corrections that give a closer approximation to reality.
Even if this were the case, there are still other questions to ponder.
In rural India, it seems to be fairly clear that per capita calorie
consumption fell over the period after the early 1980s, including in the
period when all the estimates suggest (without controversy) that the
incidence of absolute poverty was on the decline.
Some explanations of this trend have rested on the idea that this
reflects a natural and positive change in dietary patterns, consequent
upon the change in rural work patterns and life styles. Thus, Hanumantha
Rao has argued that the increasing mechanisation of agricultural
operations as well as the greater availability of mechanised transport
has reduced the amount of manual labour and physical activity related to
transport that is required in most of rural India. He suggests that this
has meant a reduction in the biological requirement of energy.
Similarly, it has been argued that the increasing "urbanisation" of
rural areas has meant that urban lifestyles have penetrated into rural
areas, and have influenced the narrowing down of rural-urban differences
in food consumption. This is used to explain the convergence in calorie
consumption as well. However, it should be noted here that the
convergence that appears at the aggregate level does not appear when the
population is disaggregated according to expenditure classes. Indeed,
the top 30 per cent in the urban areas appear to be consuming
substantially more calories at the end of the period, even while the
bottom 30 per cent do not show such an increase.
These arguments all relate to the notion of a "norm" of calorie
consumption, which has itself come under question. Of course, a minimum
calorie consumption line has been used in India since the 1950s to
determine the food consumption necessary for survival, and this has then
been used to derive "poverty lines" based on consumer expenditure
patterns. But several decades ago, P. V. Sukhatme had argued that such
rigid norms were not valid, since the human body has adaptation
mechanisms with different metabolic properties for those with lower body
weights. In other words, those who already weigh less could also require
less calories per day, even to do similar kinds of work.
In
India the norm that has been conventionally used is that of 2400
calories per day (for a rural male engaged in moderate activity). The
norm specified by the Food and Agriculture Organisation (FAO) for South
Asia as a whole is much lower, at 2110 calories per day. The FAO has an
even lower cut-off for its "lowest range of food requirement" of only
1810 calories per day.
The FAO has in fact brought down its calorie norms over time, reflecting
factors such as those mentioned by Hanumantha Rao, as well as the
reduced incidence of certain types of disease that also has reduced the
need for the body to build up resistance to it. There are also social
and cultural factors involved. This is even apparent in regional
variations in India, where it is clear that the median requirement of
calories in states like Gujurat or Tamil Nadu seems to be much lower
then in Punjab or Haryana.
So is it the case, then, that the decline in per capita calorie
consumption is simply a positive reflection of development in various
forms? Unfortunately, such an optimistic conclusion cannot be arrived at
so easily, and may probably be misleading. While very rigid norms may
not be successful at allowing for differential requirements of
individuals, there are other ways to estimate a possible nutritional
deficit. One way is in terms of defining a reference "consumer unit" and
then applying conversion factors to all the population according to age
and gender.
This is what the NSS has been doing with its definition of a consumer
unit at 2700 calories, which it has taken as the daily calorific
requirement of a normal male person doing sedentary work and belonging
to the age group 20-39 years. Other persons are assigned conversion
factors based on age and gender, so that each household can then be
defined in terms of the number of consumer units, which would be less
than the number of household members.
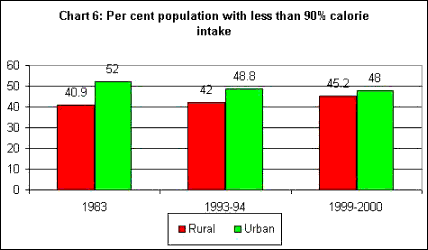
This provides some indication of aggregate nutritional deficiency.
Calorie consumption at less than 90 per cent would indicate nutritional
deficiency. There are also suggestions of the prevalence of far greater
nutritional deficiency at less than 70 per cent of the consumer unit
norm. Nevertheless, here we consider only the broader estimate.
Chart 6 provides estimates of how such nutritional deficiency has moved
over time. The results are quite stark. In the rural areas, the
percentage of population with less than 90 per cent of the norm of
calorie intake increased from 40 per cent in 1983 to 45 per cent in
1999-2000. And if the sense that the latest period survey overestimated
food consumption is correct, the ratio is likely to be even higher. In
the urban areas, the proportion of nutritionally deficient population
declined to around 48 per cent by the early 1990s, but appears to have
remained at that level thereafter.
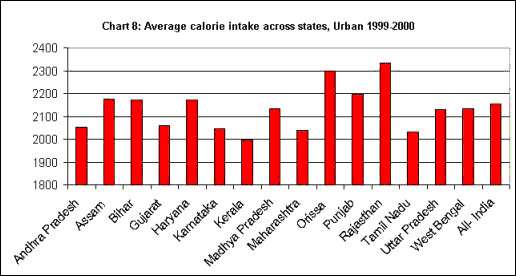
Of course, this all-India figure hides very substantial regional
variation. Charts 7 and 8 indicate just how marked such variation is
across states, in terms of average per capita calorie consumption across
the rural and urban areas of the major states. The lowest rural average
nutrient intake is to be found in the states of Assam, Gujarat, Kerala,
Maharashtra and Tamil Nadu. Note that these are not (except Assam)
states with above-average incidence of rural poverty, and indeed have
higher than average per capita income. Furthermore, in several of these
states (except Kerala and Maharashtra) the average intake worsened over
the 1990s.
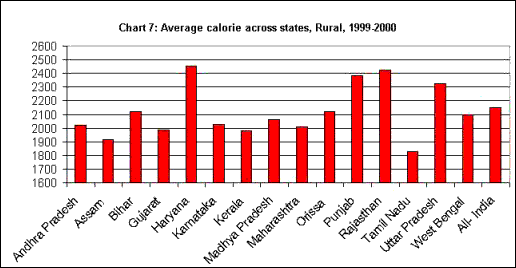
Another state with relatively poor nutrient intake is Andhra Pradesh, in
which also the situation appears to have worsened over time. This is
especially surprising in view of the fairly extensive and highly
subsidised Public Distribution System that was set up by the state
government, although the reduction in food subsidy over the 1990s may
have played some role in the worsening intake in rural areas in that
state. Karnataka also indicates low average calorie intake in the rural
areas.
It is of course possible that such state-wise variations are related to
differing physiological requirements and cultural habits. However,
another factor may also be at work: the deficiency of cereals production
in these states. The Report of the High-Level Committee on Long-Term
Grain Policy (July 2002) makes the following point: "Along with Bihar,
these states have the lowest per capita cereals production among all the
major states. This not only emphasises the continued importance of
cereals even in relatively rich states, but also the limitations of
trade.
A production deficit by itself does not imply food insecurity but
involved additional costs and effort of getting supplies from elsewhere.
Deficit production and relatively long distances from surplus regions
lead to relatively high prices, e.g. NSS implicit prices of cereals
purchased were 30-70 per cent higher in the South Indian states of
Karnataka, Kerala and Tamil Nadu than in Uttar Pradesh. This restrains
cereal consumption and keeps total nutrient intake even below that in
the poorest states.” (page 120).
Two
important points are made here: the relevance of local production in
states, and the role of price movements of food, and cereals in
particular. This latter factor may be a key element in explaining the
calorie consumption puzzle, especially in the 1990s, since the decline
in calorie intake is closely related to the fall in cereals consumption.
This was a decade marked by rising relative prices of cereals, all over
India. While the NSS data show that cereals consumption has declined and
that of non-cereals has increased, it is important to note that the
share of cereals in food expenditure has not fallen. The fact
that cereals prices increased faster than other food prices may have
prompted a shift towards other kinds of food to the extent possible, and
caused the decline in actual cereal intake (and therefore calorie
intake). It should be remembered that cereals still account for half the
food expenditure of the poor, and its share in household food budgets
remains largely unchanged.
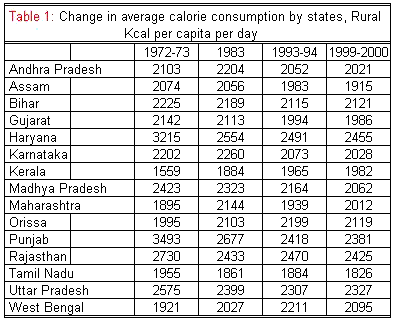
Tables 1 and 2, which present data on the changes in per capita calorie
consumption in the rural and urban areas of the major states, bring to
light further puzzles. The general decline in rural per capita calorie
consumption is not universal; some states like Orissa (one of the
poorest states) and Maharashtra actually show improvement after 1983.
The decline is very sharp in rural Haryana and Punjab, which are richer
states, but also in Madhya Pradesh and Rajasthan, which are poorer
states. All these issues deserve much more careful investigation and
analysis.
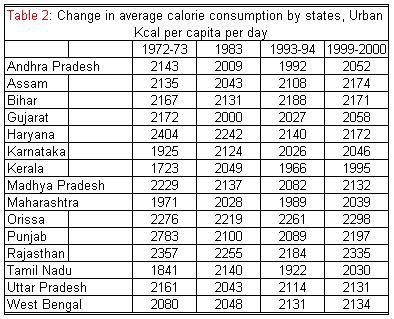
In
urban areas, by contrast, average calorie consumption appears to have
increased after 1983, in most states. The states where it has declined
(such as Haryana, Karnataka and Kerala) are not distinguished by any
common feature that could explain the decline.
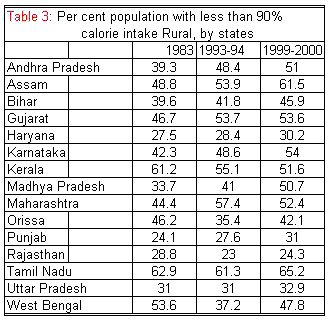
However, in terms of extent of nutrition deficiency, the trend appears
to be much more definitive. As Table 3 shows, across the major states of
India, the proportion of people with nutritional intake less than 90 per
cent of the norm, increased, especially after 1993. In some cases, as in
West Bengal, this reflected an increase after a decade of decline, such
that the 1999-2000 figure was still below that of 1983. But in most
other states, the ratio of nutritionally deficient population kept
increasing. In some states this increase was quite sharp, including in
Andhra Pradesh.
In urban areas, the picture is more mixed. For the decade 1983-93, there
appears to have been a decline, but substantially the proportion of
nutritionally deficient population has stagnated at fairly high levels.
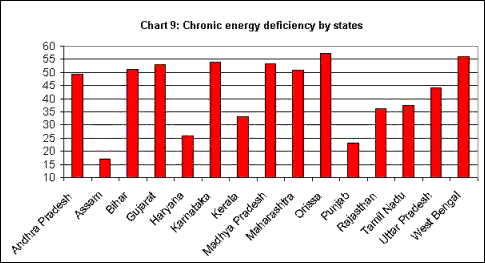
Another way to estimate the extent of adequacy of nutrition is to
estimate chronic food deficiency based on body-mass indicators. Such an
estimate for the major states, based on work done by the M.S.
Swaminathan Foundation, is represented in Chart 9. This indicates very
high levels of chronic energy deficiency of 50 per cent or more in many
of the major and most populous states. The outlier here is Assam, for
unknown reasons.
All in all, the picture that emerges throws up more questions than can
be answered here, especially in terms of the trend and regional pattern
of calorie consumption. But the basic conclusion that must be drawn is
that the current state of nutritional intake in the country is quite
appalling, and needs immediate policy attention to ensure adequate
access to food to people across the country.